

Looker Studio Marketing Dashboards: Best Practices for Better Reporting
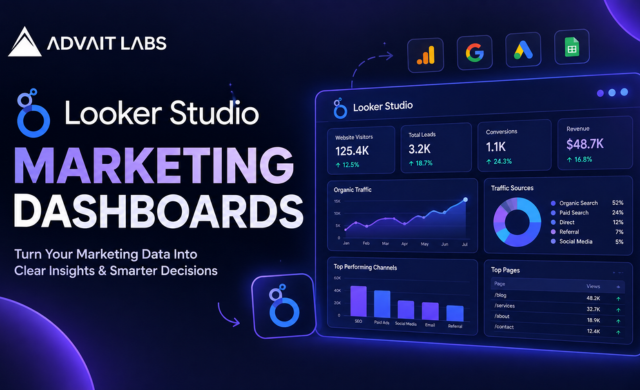
Digital marketing decisions depend heavily on accurate data. Businesses track website visitors, advertising performance, search rankings, leads, conversions, and customer behaviour across multiple platforms. However, when this information is spread across different tools, understanding overall performance becomes difficult.
Looker Studio helps businesses simplify this process by transforming complex marketing data into easy-to-understand visual reports. With the right dashboard setup, marketing teams can monitor important metrics, identify opportunities, and make faster decisions based on real-time insights.
At Advait Labs, we help businesses in Hyderabad build data-driven digital marketing solutions that improve visibility, performance tracking, and campaign efficiency. A well-designed Looker Studio dashboard helps teams move beyond collecting data and focus on using insights to achieve better results.
Want to improve your marketing reporting process? Connect with Advait Labs to create customised analytics solutions for your business.
What Is Looker Studio?
Looker Studio is Google’s free data visualization and reporting platform that allows users to connect data from multiple sources and create interactive dashboards.
Instead of manually collecting reports from different platforms, marketers can combine information into a single dashboard that provides a complete view of marketing performance.
Looker Studio can connect with platforms such as:
- Google Analytics 4
- Google Search Console
- Google Ads
- Meta Ads
- YouTube Analytics
- Google Sheets
- CRM platforms
- Third-party marketing tools
Businesses use these dashboards to track important performance indicators and understand how different marketing activities contribute to growth.
Why Businesses Use Looker Studio Marketing Dashboards
Marketing teams often manage multiple campaigns across different channels. Without proper reporting systems, valuable insights can be missed.
A Looker Studio marketing dashboard helps businesses solve common reporting challenges.
Centralised Marketing Data
Instead of checking multiple platforms individually, teams can view important marketing information in one place.
For example, a single dashboard can show:
- Website traffic from Google Analytics
- Keyword performance from Search Console
- Paid campaign results from Google Ads
- Lead generation data from CRM systems
This makes performance analysis faster and more efficient.
Automated Marketing Reporting
Manual reporting requires regularly exporting data, updating spreadsheets, and preparing presentations.
With Looker Studio, reports can be automated. Once data sources are connected, dashboards can refresh automatically based on the selected settings.
Benefits include:
- Reduced manual work
- Faster reporting cycles
- Consistent data presentation
- Easier client reporting
Better Decision-Making Through Data
Numbers alone do not provide insights. A properly structured dashboard helps businesses understand what those numbers mean.
For example:
- Increasing website traffic but fewer leads may indicate conversion issues.
- Higher ad spending with lower returns may require campaign optimisation.
- Growing organic traffic may show successful SEO efforts.
Looker Studio helps marketers identify these patterns quickly.
Best Practices for Creating Looker Studio Dashboards
Creating a dashboard is simple, but creating one that supports business decisions requires proper planning.
1. Define Clear Dashboard Objectives
Before adding charts and metrics, decide what the dashboard should achieve.
A dashboard should answer specific business questions.
Examples:
- Which marketing channels generate the most leads?
- How are advertising campaigns performing?
- Which website pages attract valuable visitors?
- Are marketing efforts improving conversions?
Avoid creating dashboards that only display large amounts of data without purpose.
2. Select the Right Marketing KPIs
A common mistake is including too many metrics. More data does not always mean better insights.
Choose KPIs that directly connect with business goals.
Website Performance KPIs
Important website metrics include:
- Users
- Sessions
- Engagement rate
- Traffic sources
- Landing page performance
- Conversion rate
Paid Advertising KPIs
For Google Ads or Meta Ads reporting, track:
- Impressions
- Clicks
- Click-through rate (CTR)
- Cost per click (CPC)
- Cost per lead (CPL)
- Conversion rate
- Return on ad spend (ROAS)
SEO Performance KPIs
An SEO dashboard in Looker Studio can include:
- Organic traffic
- Search impressions
- Search clicks
- Average keyword position
- Top-performing pages
- Click-through rate
Selecting relevant KPIs ensures that the dashboard provides useful business insights.
3. Keep Dashboard Design Simple
A good dashboard should be easy for anyone to understand, even without technical knowledge.
Follow these design practices:
- Organise information into sections
- Use clear headings
- Avoid unnecessary charts
- Highlight important numbers
- Maintain consistent formatting
- Keep the layout clean
A cluttered dashboard makes it harder to identify important information.
4. Choose Suitable Data Visualisations
The right visual format helps users understand information quickly.
Scorecards
Best for displaying key numbers.
Examples:
- Total leads
- Revenue generated
- Website users
- Ad spend
Line Charts
Useful for analysing changes over time.
Examples:
- Monthly traffic growth
- Conversion trends
- Campaign performance
Bar Charts
Useful for comparing different categories.
Examples:
- Campaign performance comparison
- Traffic source analysis
Tables
Useful when users need detailed information.
Examples:
- Keyword rankings
- Campaign-level performance
- Landing page reports
Using appropriate visualisations improves dashboard usability.
5. Create Channel-Specific Dashboards
A single dashboard containing every marketing metric can become difficult to analyse.
Creating separate dashboards for different channels improves clarity.
SEO Dashboard
Tracks:
- Organic growth
- Search performance
- Keyword visibility
- Content performance
Paid Media Dashboard
Tracks:
- Campaign spending
- Leads
- Conversions
- Cost efficiency
Social Media Dashboard
Tracks:
- Reach
- Engagement
- Audience growth
- Content performance
Channel-specific dashboards help teams focus on relevant insights.
6. Ensure Accurate Data Tracking
A dashboard is only useful when the data behind it is accurate.
Before creating reports, verify:
- Google Analytics tracking setup
- Conversion tracking
- Event tracking
- Data source connections
- Date range settings
Incorrect tracking can lead to wrong conclusions and poor marketing decisions.
7. Use Filters for Better Analysis
Filters allow users to explore specific information without creating multiple dashboards.
Useful Looker Studio filters include:
- Date range
- Campaign name
- Marketing channel
- Location
- Device category
- Landing page
For example, a business operating in multiple locations can analyse campaign performance by city.
How Looker Studio Helps Digital Marketing Agencies
Digital marketing agencies handle multiple clients, campaigns, and reporting requirements. Preparing manual reports for every client can consume significant time.
Looker Studio helps agencies:
- Automate client reports
- Provide transparent performance updates
- Combine multiple marketing channels
- Monitor campaign progress
- Identify growth opportunities
For agencies offering SEO, paid advertising, and social media services, dashboards create a more efficient reporting workflow.
Advait Labs helps businesses in Hyderabad implement data-driven marketing solutions, including customised Looker Studio dashboards that simplify reporting and improve decision-making.
Frequently Asked Questions About Looker Studio
What is Looker Studio used for in marketing?
Looker Studio is used to create interactive marketing dashboards that combine data from multiple sources into one visual report. Businesses use it to track website performance, advertising results, SEO growth, leads, and other important marketing KPIs.
How can Looker Studio improve marketing reporting?
Looker Studio improves marketing reporting by automating data collection and presenting information through easy-to-understand dashboards. It reduces manual reporting work and helps teams identify trends, challenges, and opportunities faster.
Can Looker Studio connect with Google Analytics 4?
Yes, Looker Studio can connect with Google Analytics 4 and display website performance data such as users, sessions, engagement rate, traffic sources, events, and conversions.
Is Looker Studio free to use?
Yes, Google provides Looker Studio as a free reporting and data visualization platform. Businesses can create dashboards and connect various Google data sources without paying for the basic version.
What are the best KPIs to include in a Looker Studio marketing dashboard?
The best KPIs depend on business goals. Common marketing dashboard metrics include website traffic, leads, conversion rate, cost per acquisition, ROAS, organic traffic, search rankings, and campaign performance.
Can Looker Studio integrate with Google Ads and Meta Ads?
Looker Studio can integrate with Google Ads directly. Meta Ads and other platforms can also be connected using third-party data connectors to create unified marketing reports.
How do businesses create effective Looker Studio dashboards?
Businesses can create effective dashboards by defining clear goals, selecting relevant KPIs, using simple visualizations, connecting accurate data sources, and designing reports based on user requirements.
Why should companies use Looker Studio for digital marketing analytics?
Companies use Looker Studio because it helps combine marketing data from different platforms, automate reporting, improve visibility, and support better data-driven decisions.
